Caseload churn
I pulled caseload data from Ambiki one evening expecting to confirm what I already believed. A therapist has their patients. They see them weekly. The list changes slowly over time. Stable, predictable, manageable.
The data said otherwise.
Between 38% and 50% of therapist-patient pairs turn over every single month. Not annually. Monthly.
This does not mean half of patients are leaving therapy each month. Many are reassigned, seen for evaluations only, temporarily paused, or scheduled with different therapists. But it does mean the composition of any given therapist's caseload is far more fluid than the word "caseload" suggests.
The August-to-September transition is the most volatile, with nearly half the roster turning over in a single month. Even in the calmer months, about 40% of pairs change.
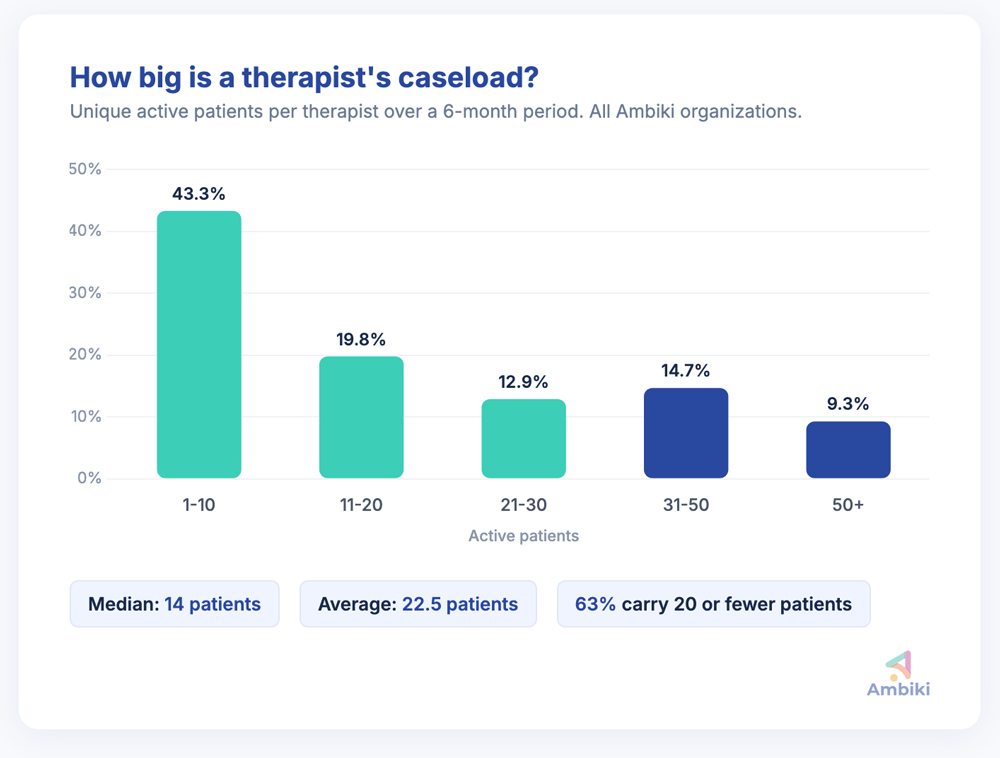
So I dug into the rest of the numbers. The median therapist on Ambiki has 14 active patients, but the average is 22.5. That gap tells you the distribution is lopsided. Nearly half of therapists (43%) carry 10 patients or fewer. Some of these are part-time or PRN therapists, though small caseloads can also reflect specialization, evaluation-heavy roles, or transitional periods within a practice. At the other end, the busiest therapists see 50 or 60 unique patients in a month. The "typical" caseload depends entirely on which therapist you're looking at.
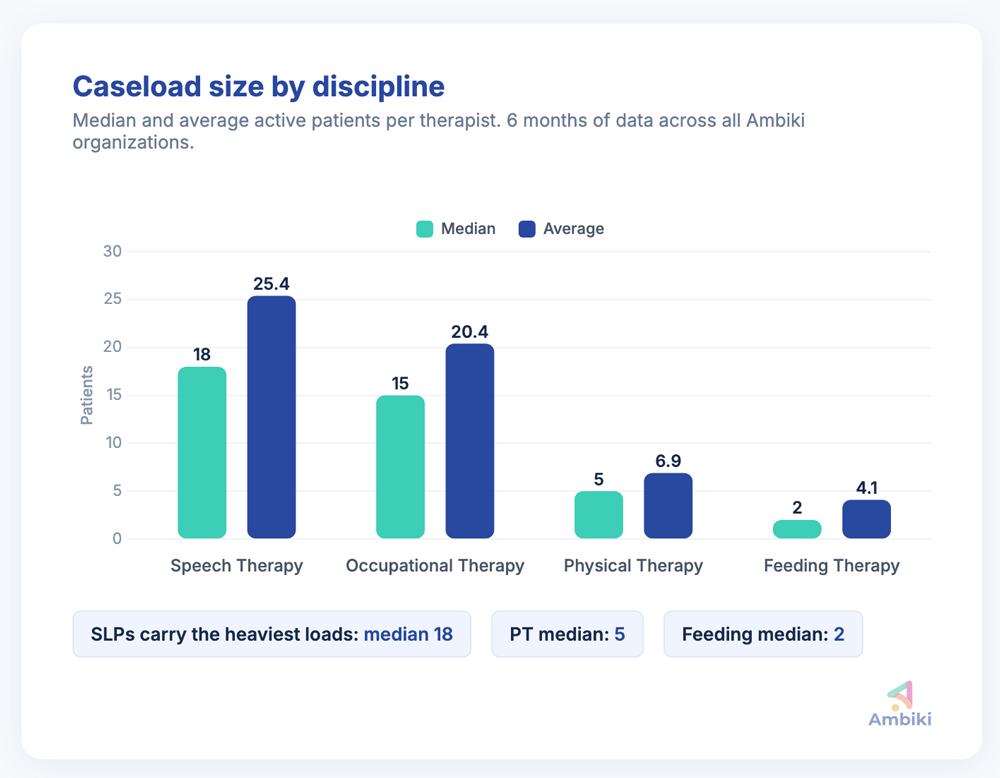
Discipline explains a lot of the variation. Speech-language pathologists carry the heaviest loads, with a median of 18 patients and an average of 25.4. Occupational therapists sit close behind at 15 median, 20.4 average. Physical therapists carry much smaller caseloads (median of 5), and feeding therapists even smaller (median of 2). The shape of the work differs by specialty, and caseload size reflects that. Worth noting: Ambiki's target market is pediatric speech therapy private practices. Even when those practices serve OT and PT, speech tends to be the largest discipline, so the lower PT and feeding numbers here reflect the mix of patients at these clinics, not the nature of those caseloads everywhere.
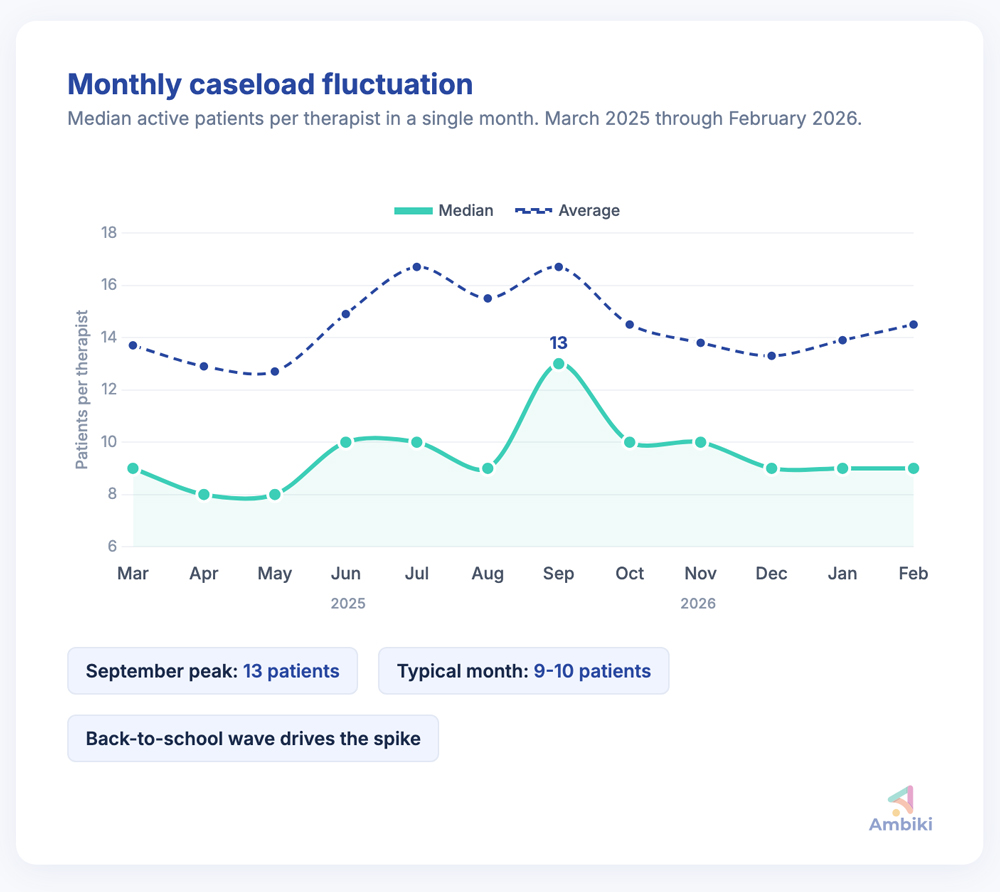
The caseload numbers also track the school calendar closely. August is the biggest discharge month at 18.7%, as practices wrap up cases before summer ends and the new school year begins. September is peak season, when the median jumps to 13 patients per therapist, compared to a typical 9 or 10. The back-to-school wave hits, caseloads swell, and then they gradually settle back down through the fall. There's a secondary intake spike in January, driven by new insurance years and fresh referrals.
Larger caseloads do not necessarily mean fewer sessions per patient. Therapists with mid-size caseloads (21–30 patients) actually see the most sessions per patient over a three-month period, averaging 5.0 sessions compared to 2.6 for the smallest caseloads (1–10 patients). Those smaller caseloads likely include part-time therapists or clinicians focused primarily on evaluations. The very largest caseloads (50+) do show some dilution, dropping to an average of 3.6 sessions per patient, but the relationship is flatter than you might expect. That does not necessarily mean the work is lighter or heavier. Session frequency is shaped by plan of care, authorization limits, and patient needs, not just caseload size.
Caseloads are seasonal, discipline-dependent, and constantly changing. A therapist’s caseload is less a fixed list and more a rolling snapshot. One third to half the names differ from one month to the next. Behind each of those names is a new treatment plan to write, a new family to get to know, and a new set of goals to track. That is the part the data does not capture: an SLP is not just managing 18 patients. They are taking on new goals, new families, and new clinical context, while still showing up to each session with continuity and confidence.